


 11 / 13

11
2016 HCAOA ANNUAL LEADERSHIP CONFERENCE
PARTNERSHIP PROSPECTUS
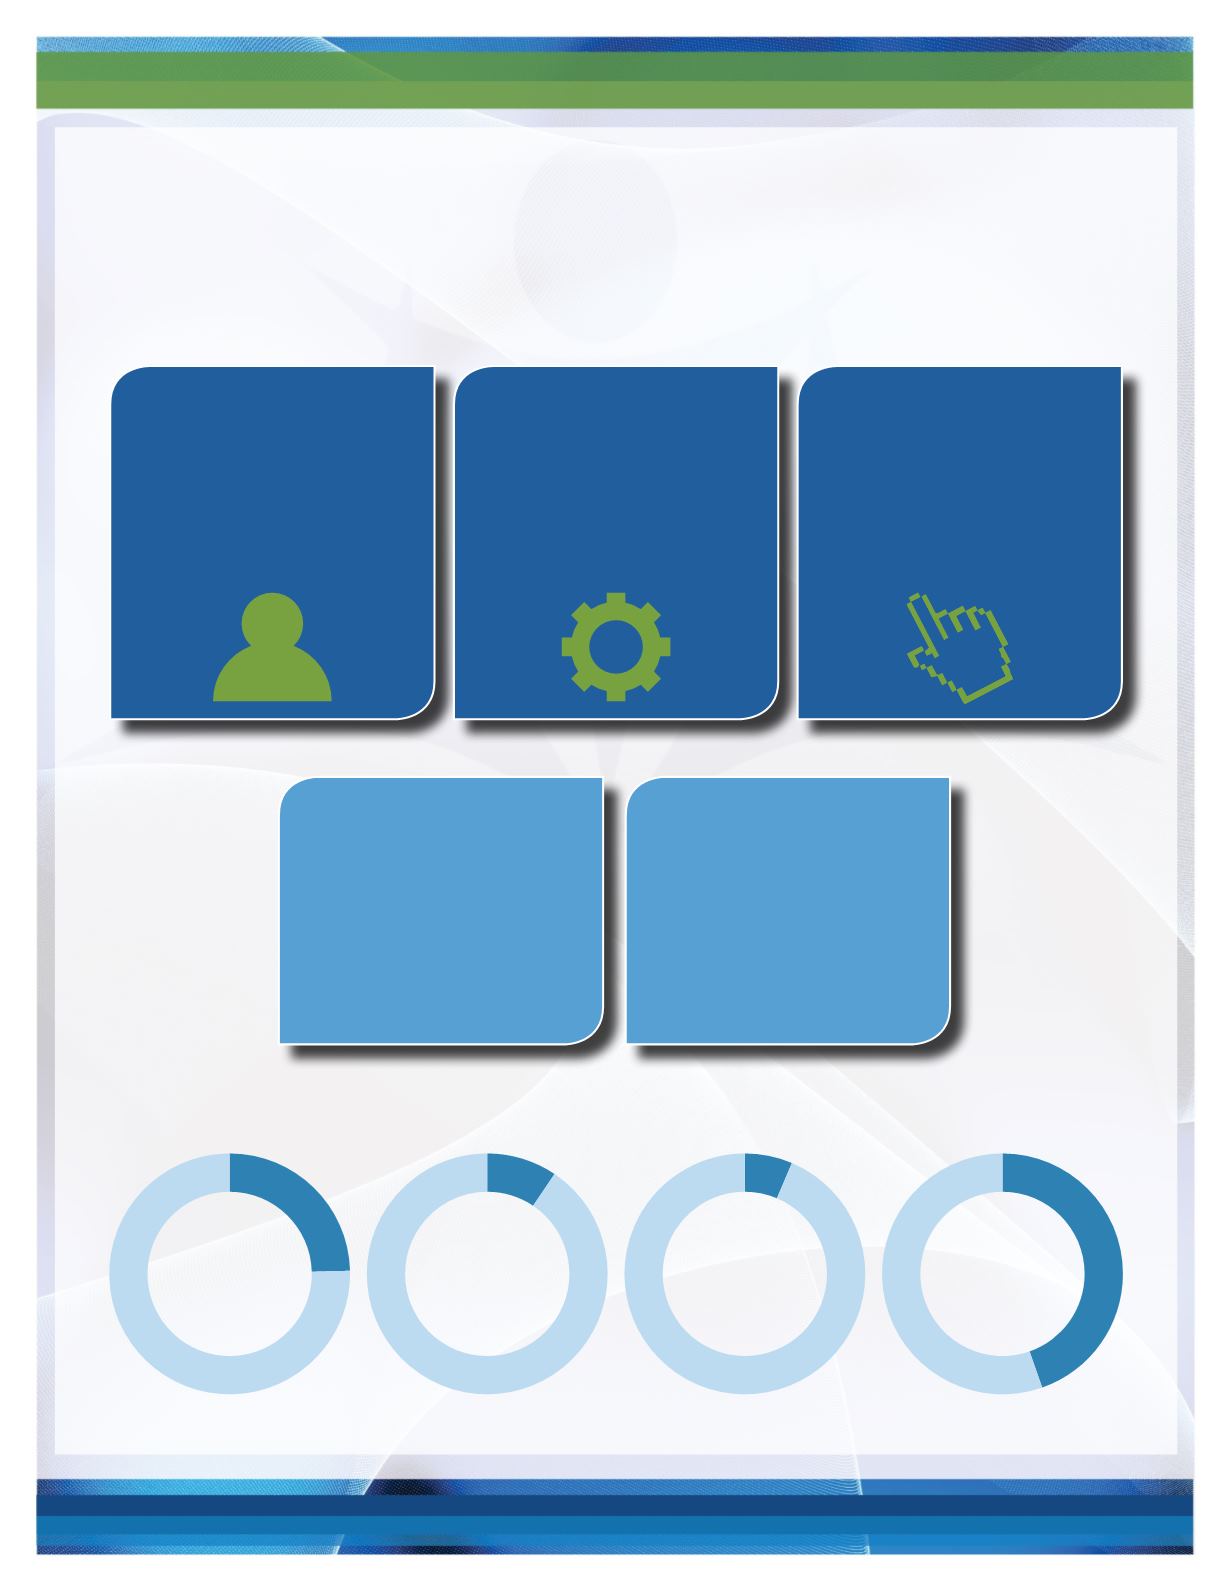
2015 CONFERENCE APP ACTIVITY STATISTICS
OVERVIEW
TOP ACTIONS
The 2015 Conference App was a resounding success!
Please see the following app statistics below.
226
active users
53,420
total in-app
actions
236.37
avg number of
actions per user
303
Exhibitor
Breakdown
Total Views
592
Speaker
Breakdown
Total Views
1,214
198
check-ins
bookmarks
489
status updates
95
surveys
203
comments
286
photos
2,190
likes
365
ratings